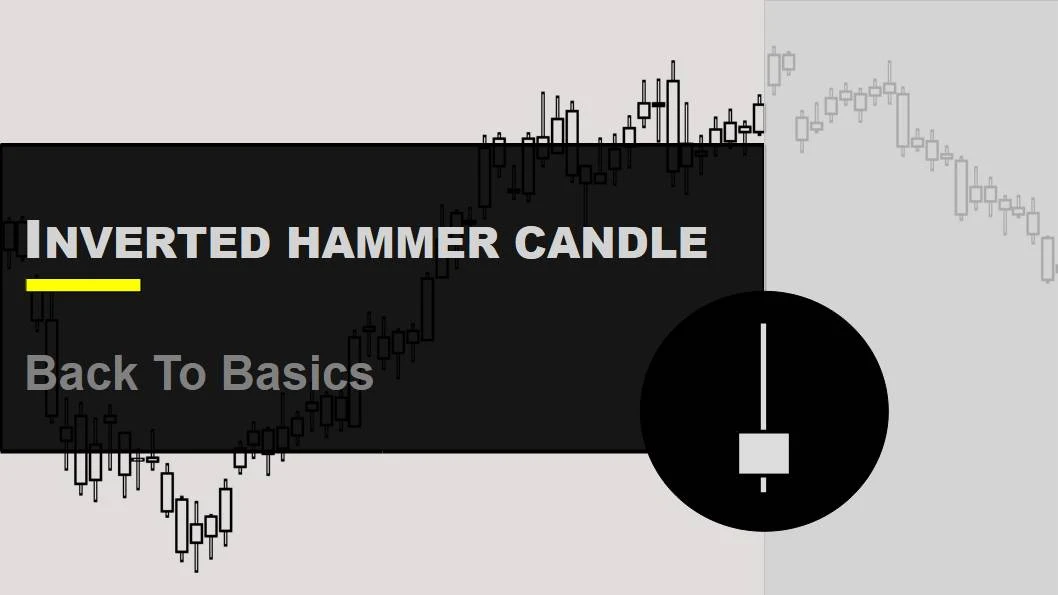
Introduction to Hammer Candle

In this module, we are going to discuss the Hammer candle, which gives a very strong signal of a trend reversal (probably to uptrend). We'll show you what this looks like, its characteristics, and valid conditions for this candle.
In addition, we'll look at the psychology behind the Hammer candle and discuss predictions for the future.
The first thing we want to discuss with you is what a Hammer candle is.
Most traders believe that a candle can only be classified as a true hammer if its bottom shadow is twice the size of its body section and if the body is situated towards the upper end of the trading range.
Hammer Candle Anatomy

Characteristics of a Hammer
| Feature | Character |
|---|---|
| Formation | A Hammer candle is made of a single candle. |
| Color | A Hammer candle can be green or red. |
| Real Body Position | The real body is situated at the top end of the session's range. |
| Shadow | There is little to no upper shadow is present. |
| Shadow Size | The lower shadow should be at least twice the height of the real body. |
| Range | The range of a Hammer candlestick pattern is large, indicating significant price movement during the trading session. |
| Volatility | Volatility is high. |
| Trend | The Hammer candlestick pattern is typically observed in a downtrend, signaling a potential reversal. |
| Momentum | Momentum shifts from selling to buying, indicating potential reversal. |
| Symmetry | The pattern is asymmetrical with a small real body and long lower shadow. |
| Volume | Volume may be high, but it’s not a defining feature of the pattern. |
In candlestick analysis, it's an uncommon occurrence to come across a pattern that accurately resembles its name, but the Hammer pattern is one such exception, with a small, plump head and a lengthy handle, resembling an actual hammer.
Blueprint of a Hammer on chart

Conditions for Hammer to be valid
- The color of the body in a Hammer candlestick pattern is generally considered to be less important than other aspects, but a green body can be interpreted more positively than a red body.
- One possible outcome after the formation of a Hammer candlestick pattern is that buying activity continues in the next trading session.
- The stock must have been in a definite downtrend before this signal occurs. This can be visually verified on the chart.
Predictions:
Hammer candle gives a strong sign for a trend reversal to uptrend. The presence of a gap can strengthen the signal provided by a Hammer candlestick pattern.
Limitations of the Hammer Candlesticks
- False Signal: In volatile markets, a Hammer candle may cause traders to enter the trade incorrectly.
- Dependence on Confirmation: This candle requires an additional indicator or price action to provide accurate signals.
- Movement: A Hammer candle mostly shows short-term price fluctuations rather than long-term trends.
- Market view: The overall market structure affects effectiveness.
- Limited Use in Strong Trends: Less reliable in strong upward or downward trends.
- Asset Variation : Success rates can vary depending on the type of financial instrument.
- Point of View: Traders may interpret the hammer differently.
- Volume Factor: Low trade volume can reduce the pattern's validity.


