Introduction to Inverted Hammer Candle

In this module, we are going to discuss the Inverted Hammer candle, which gives a very strong signal of a trend reversal (probably to uptrend). We'll show you what this looks like, its characteristics, and valid conditions for this candle.
In addition, we'll look at the psychology behind the Inverted Hammer candle and discuss predictions for the future.
The first thing we want to discuss with you is what a Inverted Hammer candle is.
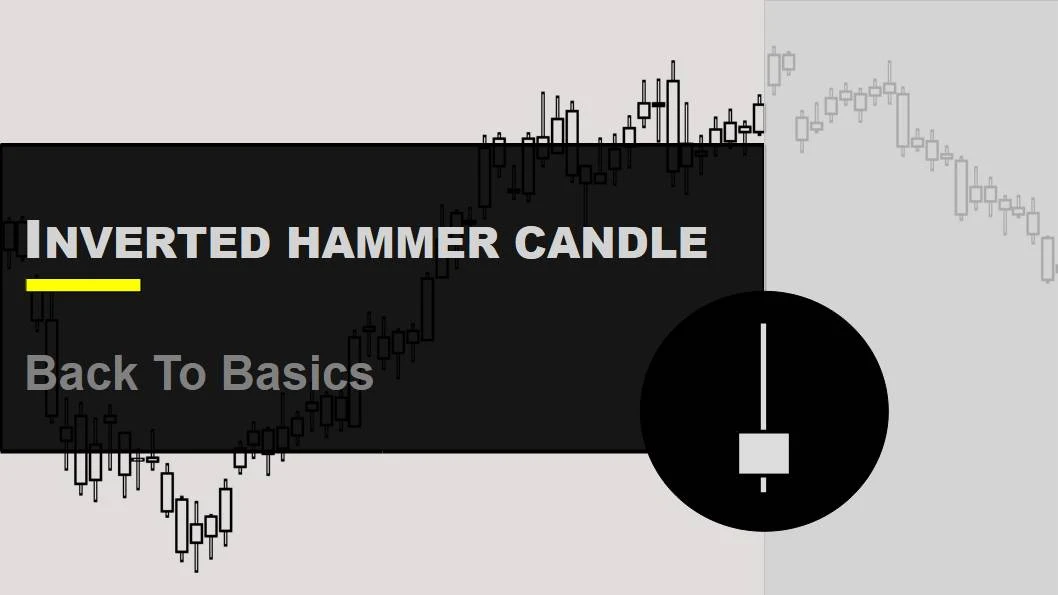
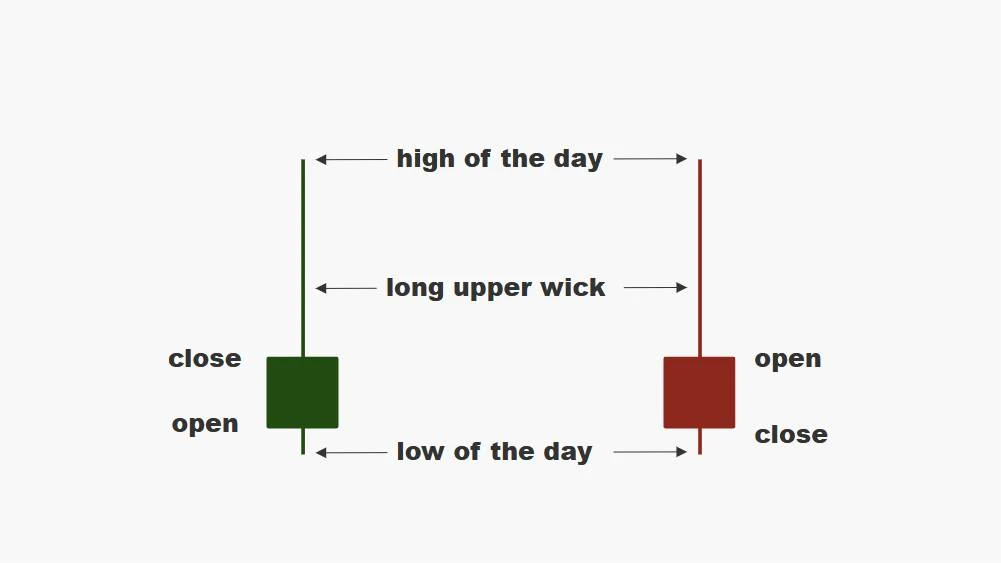
During a downtrend, a candle with a small real body at the bottom, little to no lower shadow, and a long upper shadow is called an inverted hammer candle
Most traders believe that a candle can only be classified as a true inverted hammer if its upper shadow is twice the size of its body section and if the body is situated towards the bottom end of the trading range.
Inverted Hammer Candle Anatomy

Characteristics of an Inverted Hammer candle
| Feature | Character |
|---|---|
| Formation | An Inverted Hammer candle is made of a single candle. |
| Color | The Inverted Hammer candle can be green or red. |
| Real Body Position | The real body is situated at the bottom end of the session's range. |
| Shadow | Little to no lower shadow is present. |
| Shadow Proportion | The upper shadow should be at least twice the height of the real body. |
| Range | The range of an Inverted Hammer candlestick pattern can be wide, indicating notable price movement during the session. |
| Volatility | Volatility is high. |
| Trend | The Inverted Hammer is typically observed in a downtrend, signaling a potential reversal. |
| Momentum | Momentum shifts from selling to buying, indicating a potential bullish reversal. |
| Symmetry | The pattern is asymmetrical with a small real body and a long upper shadow. |
| Volume | Volume may increase but is not a primary characteristic of this pattern. |
Blueprint of a Inverted Hammer on chart

An Inverted Hammer candlestick occurs during a downtrend and indicates the possibility of a counter-trend, meaning a reversal to an uptrend.
Limitations of the Inverted Hammer Candlestick Pattern
- False Signal: In volatile markets, the Inverted Hammer can lead to misleading signals and incorrect trade entries.
- Dependence on Confirmation: This pattern requires additional confirmation from other indicators or price action for accurate trading signals.
- Movement: The Inverted Hammer primarily indicates short-term price movements and may not predict long-term trends.
- Market View: The effectiveness of the Inverted Hammer can vary based on the overall market structure and conditions.
- Limited Use in Strong Trends: This pattern is less reliable when the market is strongly trending in one direction.
- Asset Variation: The success rate of the Inverted Hammer can differ across various financial instruments.
- Point of View: Traders might have different interpretations of the Inverted Hammer, leading to inconsistent trading strategies.
- Volume Factor: Low trading volume can diminish the validity of the Inverted Hammer pattern, making volume analysis essential.
Next In Line


