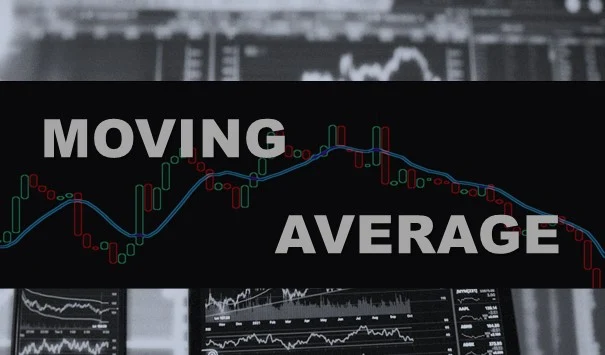
The Moving Average Indicator: A Step-by-Step Guide

Nothing distills the essence of supply and demand like the chart. And nothing distills the chart quite like the moving average.
— CLIF DROKETechnical analysts have been using moving averages now for several decades.
Moving averages are technical tools used on charts for trend identification. They can be used as standalone lines for trend trading, or in conjunction with other technical indicators like the MACD, RSI, price levels of support and resistance, or even with other moving averages.
Moving averages are one of the building blocks for other technical indicators like Bollinger Bands, MACD, and the McClennan Oscillator.
Quick Overview— Moving Average
| Introduced By | G. U. Yule (1909) |
| Category | lagging technical indicators |
| Popular Periods | 5, 8, 13, 21, 50, 100, 200 (days) |
| Timeframes | Any timeframe (min to months) |
| Range | used only one data point at a time |
| Signals | a trend following indicator |
| Motive | to eliminate short-term fluctuations in the market |
What is a moving average?
Why you should learn moving averages?
- To the untrained eye, the price chart of any given security resembles an indecipherable mess of squiggly lines with little meaning. Even to an experienced chart analyst price fluctuations can be very misleading.
- To make profits Market View ( uptrend, downtrend or sideways) should be clear. This is the function best served by moving averages.
- The use of an moving average eliminates or reduces the distraction caused by the often sudden and relatively far-reaching daily price fluctuations, enabling the user to observe a smoother depiction of the trend changes as they occur.
Last but not least, Moving averages have meaning because they are used by so many market participants.
Moving Average Timeframes
| Trend | Moving Average |
|---|---|
| Very Short Term | 5-13 days |
| Short Term | 14-25 days |
| Minor Intermediate | 26-49 days |
| Intermediate | 50-100 days |
| Long Term | 100-200 days |
How to Calculate Moving Averages
Moving averages can be calculated on any data series, including a security’s open, high, low, close, volume, or other indicator.
A moving average of another moving average is also commonly used in various forms of technical analysis.
A buy signal is generated when the security’s price rises above its moving average, and a sell signal is generated when the security’s price falls below its moving average.
Moving averages can also be calculated and plotted on indicators.
You need to ask yourself the following questions—
- How did a moving average system perform during different market environments?
- How did they perform during a flat period for stocks?
- How did they perform at the market bottom?
- How did they perform at the market top?
- Did the moving average system get you out before a big market drop?
- Does the system get you back in quickly when a market starts a new uptrend in price?
- Does the market keep you in stocks during bull
Types of Moving Average
There are many types of moving average available in the financial market like Simple Moving Average, Exponential Moving Average, Hull Moving Average, Triangular Moving Average and so on.
All these moving averages are categorized into three category—
- Ordinary Moving Averages
- Simple Moving Average
- Linear Moving Average
- Exponential Moving Average
- Moving Averages of Moving Averages
- Triangular Moving Average
- Double and Triple Exponential Smoothing
- Mixed Moving Averages with Less Lag Time
- Zero Lag Exponential Moving Average
- Double and Triple Exponential Moving Average
- Hull Moving Average
The two most popular types of moving averages are the Simple Moving Average (SMA) and the Exponential Moving Average (EMA).
It will be messy to cover all these moving averages in a single episode hence we'll discuss all the above moving averages seperately one by one.
Limitations of Moving Average
- When prices trend sideways, moving average strategies tend to generate many false signals.
The reason is when stock prices trend sideways, the value of a moving average is close to the last closing price. As a result, even small fluctuations in the price may result in a series of unnecessary trades. - The moving average trading strategies are advantageous when the trend is strong and long-lasting. The moving average strategies may disappear even if the trend is strong but short-lasting.
Keypoints— Moving Averages
- Moving averages are not the Holy Grail of trading. They are tools to help a trader capture a trend in their own time frame.
- Moving average systems perform differently in different type of markets.
- Moving averages work best in low volatility markets. The more volatile the market the less respect moving averages will be given as emotions take over market participants.
- Moving averages are the average of past price data, they aren’t predictors. Instead, they are a way of looking at the current trend.
- Most moving averages are based on closing prices.
- Moving averages have the attribute of being able to smooth price fluctuations, making it easier to follow underlying trends with the naked eye.
I always check my charts and the moving averages prior to taking a position. Is the price above or below the moving average? That works better than any tool I have. I try not to go against the moving averages; it is self-destructive.
— MARTY SCHWARTZ