Relative Strength Index Indicator [ RSI ]

RSI— stands for Relative Strength Index, is one of the most popular price momentum indicator or oscillator when an indicator fluctuates within a certain range, it is referred to as an oscillator. For example, the RSI ranges from 0 to 100. . The RSI is frequently used to identify the markets, that are overbought or oversold.
Quick Overview— RSI
| Introduced By | J. Wells Wilder (1978) |
| Category | Price Momentum Indicator |
| Popular Periods | 14(default), 5, 7, 8, 10, 20 days |
| Timeframe | Any timeframe (min to months) |
| Range | 0 to 100 |
| Signals | Overbought or oversold (traditional interpretation) |
| Motive | Measures how fast price moves |
Applications of RSI
RSI provides several signals to traders. The main applications of RSI are as follows —- Defines the current trend
- Signals overbought & oversold
- RSI can reflect support & resistance
Limitations of RSI Indicator
Like other contra-trend strategies, the RSI indicator has also some limitations which are pointed out below—
- RSI is not foolproof because RSI failed to provide any protection in the crash of 1987, the decline of 1998, and other market falls.
- RSI has no relation with economic news, earnings, and other fundamental aspects which means it can generate false signals when there is a big event in the market like the annual budget.
- RSI can remain overbought or oversold for a long period of time.
- RSI is usually used in conjunction with other forms of confirmation such as moving averages and the overall trend in the broader market.
- The RSI indicator can stay in the overbought or oversold range for a long time in heavily trending markets.
- RSI is misnamed since it has nothing to do with the Relative Strength Concept.
How To Use RSI Indicator?
The very first step is to choose a trading platform. There are numerous trading platforms to choose from. Some of them need a membership, while others don't. RSI indicator provides in-built capabilities with all trading platforms, regardless of which broker's platform you're using.
Here we are going to use TradingView. TradingView is a social network and charting platform used by retail traders and institutional investors to analyze financial securities. This is a place where you don't need technical knowledge to do technical work.
Steps to add RSI on the TradingView platform—- Go to tradingview.com & choose your stock.
- Click on Indicators & type in 'RSI' and it'll show up right here—
- Next, click Relative Strength Index and then it will be applied to your charts along the bottom.


Now let's understand how traders might use the RSI indicator to identify Buy or Sell signals.
Many investors define the market as—- Oversold when RSI is below 30 &
- Overbought when RSI is above 70
When RSI crosses back above 30, it generates a potential Bullish entry signal.
When RSI crosses back below 70, it generates a potential exit signal.

The area below the green dotted line at 30 represents the oversold region, whereas the area above the red dotted line at 70 represents the overbought region.
In a brief—- Enter Long (buy): when RSI is less than 30.
- Close Long (sell): when RSI is greater than 70.
- Enter Short: Not recommended.
Apart from this, you can use RSI to capture swing trades (Buy Low, Sell High).
Suppose you have taken a long position, then you can exit from trade when your RSI indicator crosses above 50.
The strategy shown here is the traditional way of implementing RSI, But here's the issue with using the RSI indicator in this manner—

As you can see in the chart above, the RSI indicator has already entered the oversold region, which means that if you buy, the price will go against you for a long time.
In heavily trending markets, as previously discussed in limitations, the RSI indicator can remain in the overbought or oversold range for a longer duration.
And if you continue to trade solely on the RSI indicator, expecting the price to reverse, you will most likely incur significant losses.
How do we use the RSI indicator?
We only use the RSI indicator in one way, and that is to combine the RSI with divergences or RSI divergence.
What exactly is divergence?
Divergence occurs when the price moves in the opposite direction of the RSI indicator, which can then be used to predict a potential trend change.
- In Uptrend: Price made a higher high on the price chart, but the RSI made a lower high, resulting in a divergence.
- In Downtrend: Price made a lower low on the price chart, but the RSI made a higher low, resulting in a divergence.
Consider the following example for a better understanding.
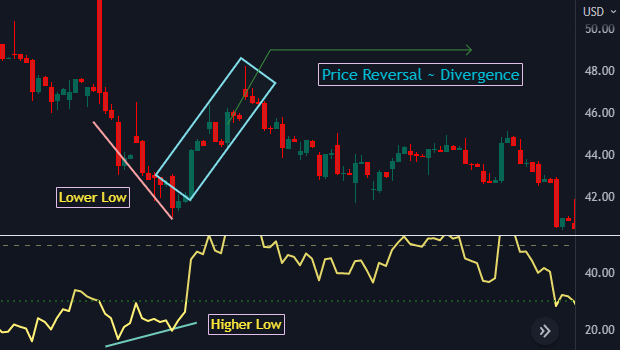
In this downtrend, the price chart made a lower low, while the RSI had a higher low, resulting in a divergence created and then a price reversal.

In this uptrend, the price chart made a higher high, while the RSI had a lower high, resulting in a divergence created and then a price reversal.