The Utility of Trendlines
Case: 6 Trendline as support
Connecting lows is another way to draw a trendline to identify potential support (refer to below figure which shows a price chart of Starbucks corporation[SBUX]). If you connect the two lows (1&2) in this chart, you might be surprised at what happens when you extend that trendline.

Case: 7 Trendline as resistance
Let's look at another scenario of the same Starbucks corporation price chart. As shown in the figure, you could have drawn the trendline by connecting the lows and then taking the parallel off the intervening low. Here you could have observed that parallel of the support is now acting as resistance.

Case: 8 Control Price
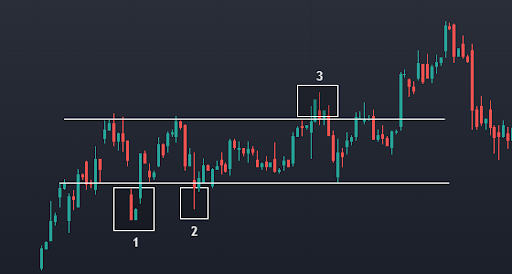
You have seen how the market gives value to certain price of area (support & resistance). Prices are fluctuating inside these support and resistance line. These ups and down movement go through a price level where the market has been showing the greatest trading activity.
That price level is referred to as the control price (rectangular boxes). It is basically a pivotal support and resistance level within the primarily support and resistance level.
As long as the price remains inside the range of support and resistance, it will be pulled to this control price and will spend more time there than anyplace else in the area.

Case: 9 Excess Price
Take note of how the pricing performs in the "1" area. It goes out of consolidation period but it spends very little time there and comes back down again to consolidation period. The same situation happens in the "3" area.
These areas (1, 2 and 3) where the price deviates from its value for a short period of time before coming back to its value, called Excess price. Excess price shows the footprint of the long term trader and his/her intention.
The less time it spends out of consolidation phase, the more significant it becomes. At area "2" in the below chart we have a tail. It has all of the characteristics and underlying effects of the excess price, but it is more powerful.

|
Top 10 Books For Day TradersLIBRARY |
Case: 10 Trend Change
Have a look at below figure, on 20 Aug 21' price chart of EURUSD pair in a shorter timeframe [4 hr]. Draw a line from extreme low point to the extreme high point then take a parallel line as shown in figure. When the prices begin breaking below this line, the previous move is done.
![Trend Change [EURUSD]](https://blogger.googleusercontent.com/img/a/AVvXsEhcgRzEoSbNEh7XuFUEiEwnA7Gi_wt_pKp6pwp_DOCrH3YoicYjFogkufZoP1a4X0DQZi5qrgRnYD410t05rciGynKPfVQr1AGqrtKW_zKlODqfKdplMOlv5M-TJkvQo08nRGG_4-Qd5-1lZkE4gEUD952agVdnU2b5AeBLeDKLIfVX9_cjNz6Fhw=rw)