What Are Trendlines?
In this 'Trendline' series, we are going to show our key "Trendlines" strategy that no one talks about. This module is basically designed for an absolute beginner to an experienced market specialist.
Moreover, we'll discuss all about trendlines that you should know as a trader or investor, teach you how to draw trendlines correctly using lots of chart examples.
We recommend you not to skip this whether you have prior knowledge of "Trendlines" or not. There's a lot to learn and lots to practice. So let us start with a simple question - "What is a line?"
A line is a set of points that are simply connected. Within the scope of technical analysis, these points are typically price highs or price lows.
What is a Trendline?
In simple words, a trendline is a line that we draw on our chart by connecting the swing highs and swing lows during a 'Trending Market'.
Downtrend:
The bottom of each 'Run' before the pullback begins, called as Swing Low (S-L) and the top of each 'Pullback' before a 'Run' begins, called as Swing High (S-H).
In downtrend, these Swing Highs and Swing Lows are reffered to as Lower Highs and Lower Lows respectively.
Uptrend:
At the top of each 'Run' before the pullback begins, called as Swing High (S-H) and the bottom of each 'Pullback' before a 'Run' begins, called as Swing Low (S-L).
In uptrend, these Swing Highs and Swing Lows are reffered to as Higher Highs and Higher Lows respectively.
Now, remember one point that price won't always move smoothly in trending market. As you can see in the above two examples few candles won't touches the trendline or exceeded the trendline that means don't look for a ideal trendline setup.
Need of trendlines
- Trendlines are important for both trend identification and confirmation
- Trendline represent the psychology between the bulls and the bears
- A gap-up or gap-down through a trendline offers the best trade setup
- Reaction on price will often occur at or near a trendline
- A trendline can determine whether the market is optimistic or pessimistic

| Trendline | Purpose of trendline |
|---|---|
| Upward line | Indicates bulls are in control |
| Downward line | Indicates bears are in control |
| Horizontal line | To identify support and resistance |
| Vertical line | To identify moments in time |
| Diagonal line | To identify both price and time |
How to draw Trendlines?
1. In a downtrend, trend lines should be drawn above the price. And this downward trendline always act as resistance.
2. In an uptrend, trend lines should be drawn below the price. And this upward trendline always act as support.

A trend line is determined by the highs in a downtrend and the lows in an uptrend.
To draw a trend line either uptrend or downtrend, at least two swing highs or swing lows are required [Rule No.1].
Some traders use the bodies of the candlesticks to draw trend lines, while others prefer the wicks. While most people will use the wicks to draw trend lines, the bodies can also be used to draw trend lines on a chart.
Trading with trendlines
There are two main approaches to trading with trendlines:- When the price finds support or resistance at the trend line, it is time to enter.
- When the price breaks through the trend line, you can enter.
Don't enter trades blindly because price has touched a trendline, you should always wait for price action
Types of trendlines
In modern technical analysis, trendlines are one of the most often utilized and misrepresented (not used correctly) techniques. There are many types of trendlines available in the financial market like an uptrend, downtrend, counter-trendline, diagonal, inner/outer trendline, and many more. But majorly there are three types of trendlines and all the others come under these.
- The Standard Trendline
- The Parallel trendline
- The Supplement Trendline
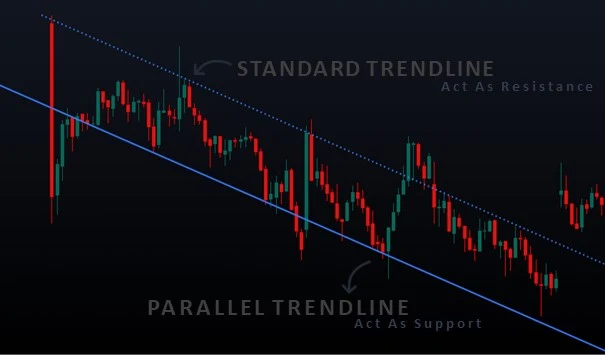
1) The Standard Trendline
- Standard trendline consist of uptrend lines or downtrend lines or both.
- Standard uptrend lines act as an support where buyers stepped in and bid the market higher.
- Standard downtrend lines act as an resistance where sellers stepped in and counter the bounce in the price.
- The correct way to draw a standard uptrend line is to connect higher lows price points.
- The correct way to draw a standard downtrend line is to connect lower high price points.

2) The Parallel Trendline
- The parallel trendline is used to identify a channel between the highs and the lows.
- If drawn correctly, you can notice the prices are confined between those two parallel lines.
- The bigger the channel, the more significant it is.
- The upper limit of the dominant area act as resistance.
- The lower limit of the dominant area act as support.
- The parallel trendlines can be drawn during an uptrend, downtrend or sideways market.
3) The Supplementary Trendline
- The supplementary trendlines are used to draw trendlines during the short period of time.
- Supplementary trendlines are used to enhance the analysis for shorter timeframe ( generally used with other type of technical analysis).
- If you are beginner, better to avoid the trade based on supplementary trendlines.
- The correct way to draw a supplementary trendline is to connect the day's low of at least two previous days to the yesterday's high point.

Know the rules
Follow these rules to see whether your trendline is significant—
- At least two peaks are connected. More connecting peaks, the more valid it is.
- The angle of 45° is significant to trendlines. Most significant trendline occur around the angle of 45°, indicating that trend is strong.
- Lower level (angle) trendlines indicate that trend is close to reversal.
- Longer timeframe trendline is better. Day charts trendlines are more significant than 1 hours charts.
- Never mind about peak penetrations (as long as 1%).
- When you draw a trendline by connecting two peaks or troughs and there is an intermediate shawdow over the trendline, this is not considered a break as long as the closing price is below the trendline.
- Last but not least, Don't force trendlines on the charts. Draw it only when it is obivous meaning anyone can spot it clearly.