Introduction to Market Trends

In financial market a trend is your friend is an important trading guideline. Because trends last for a long time, and a position taken with the trend is more likely to succeed than one taken at random or against the trend.
In this first chapter, we are going to discuss Trends, which is very important to understand as Trends reflect investor sentiment and the ongoing economic factors that influence market behaviors. We'll discuss its types and importance. In addition, we'll look at time frames in market trends, as well as tools and indicators for identifying trends.
Let's start with the question: What is a trend?
Types of trends
There are three types of trends in stock market which are as follows —
- Uptrend (Bullish Trend)
- Downtrend (Bearish Trend)
- Sideways (Consolidation or Range-Bound Market)
Now, let's discuss all the above points one by one —
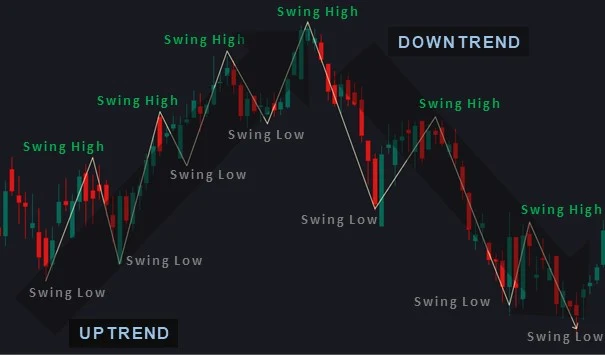
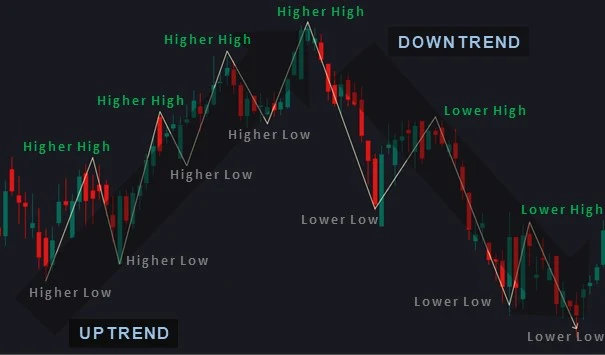
- Uptrend: Upward Trends occur when the price of a stock moves higher or in an upward trajectory. In an uptrend, the price makes higher swing highs and higher swing lows.
- Downtrend: When the price of a stock falls, this is referred to as a downward trend. In a downtrend, the price makes lower swing lows and lower swing highs.
- Sideways: A sideways trend indicates little price movement or change. There is an indecision between the buyers and the sellers hence the price of an asset neither rise nor fall. In a sideways, the price moves in a channel or within a parallel line.
Market moves following some patterns. There are only three possible direction of the market movement i.e either up (upward market), down (downward market) or sideways (flat or non trending market).
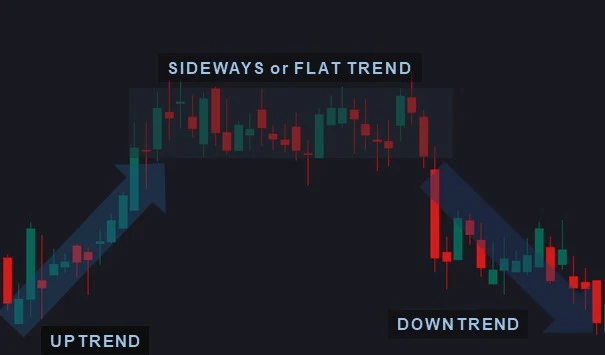
The longer the flat market the greater the outbreak will be because when the market decides the next direction (indecision vanised) then a new trend evolves and many traders follow this trend.
Some chartists draw trendlines through lows and high, other may prefer drawing lines through closes in hopes of detecting a change in trend more quickly. But wait, Do you know how to draw these trendlines correctly?
Before we go through the ploting of trendlines on the charts it is important to discuss some mandatory rules of drawing trendlines.
Role of Time Frames in Market Trends
Short-Term Trends: Typically seen over days or weeks, these are often influenced by daily news, economic reports, and immediate investor reactions.
Intermediate-Term Trends: Spanning weeks to months, these trends represent more sustained movements and are usually influenced by broader economic factors.
Long-Term Trends: Over months or years, they reflect enduring market changes and are generally based on major economic cycles.
Psychology of price movement
As you know, there are two participants in the market one is buyer and other is seller. The buyers belives price will go up and the seller feels price will decline.
Once the buyers and sellers make their trade, you can see their influence in the market. Thus, there are two aspects to every trade:
- Each trade must ultimately have an opposite reaction on the market.
- The trade will influence other traders.
- Traders who have long position
- Those who hold short position, and
- Those who have not take any position but soon will.